networkX(monthly bilateral imports) -> network statistics
from distutils.command.clean import clean
import pandas as pd
import os
import numpy as np
import networkx as nx
import matplotlib.pyplot as plt
from dbnomics import fetch_series
import warnings
warnings.filterwarnings("ignore")
International trade can be thought of as a network.
The IMF's Direction of Trade Statistics (DOTS) is a monthly bilateral trade dataset.
I downloaded this through dbnomics. The IMF's data API is inferior to using dbnomics.
With this data various network statistics can be calculated. I used networkX to do these calculations.
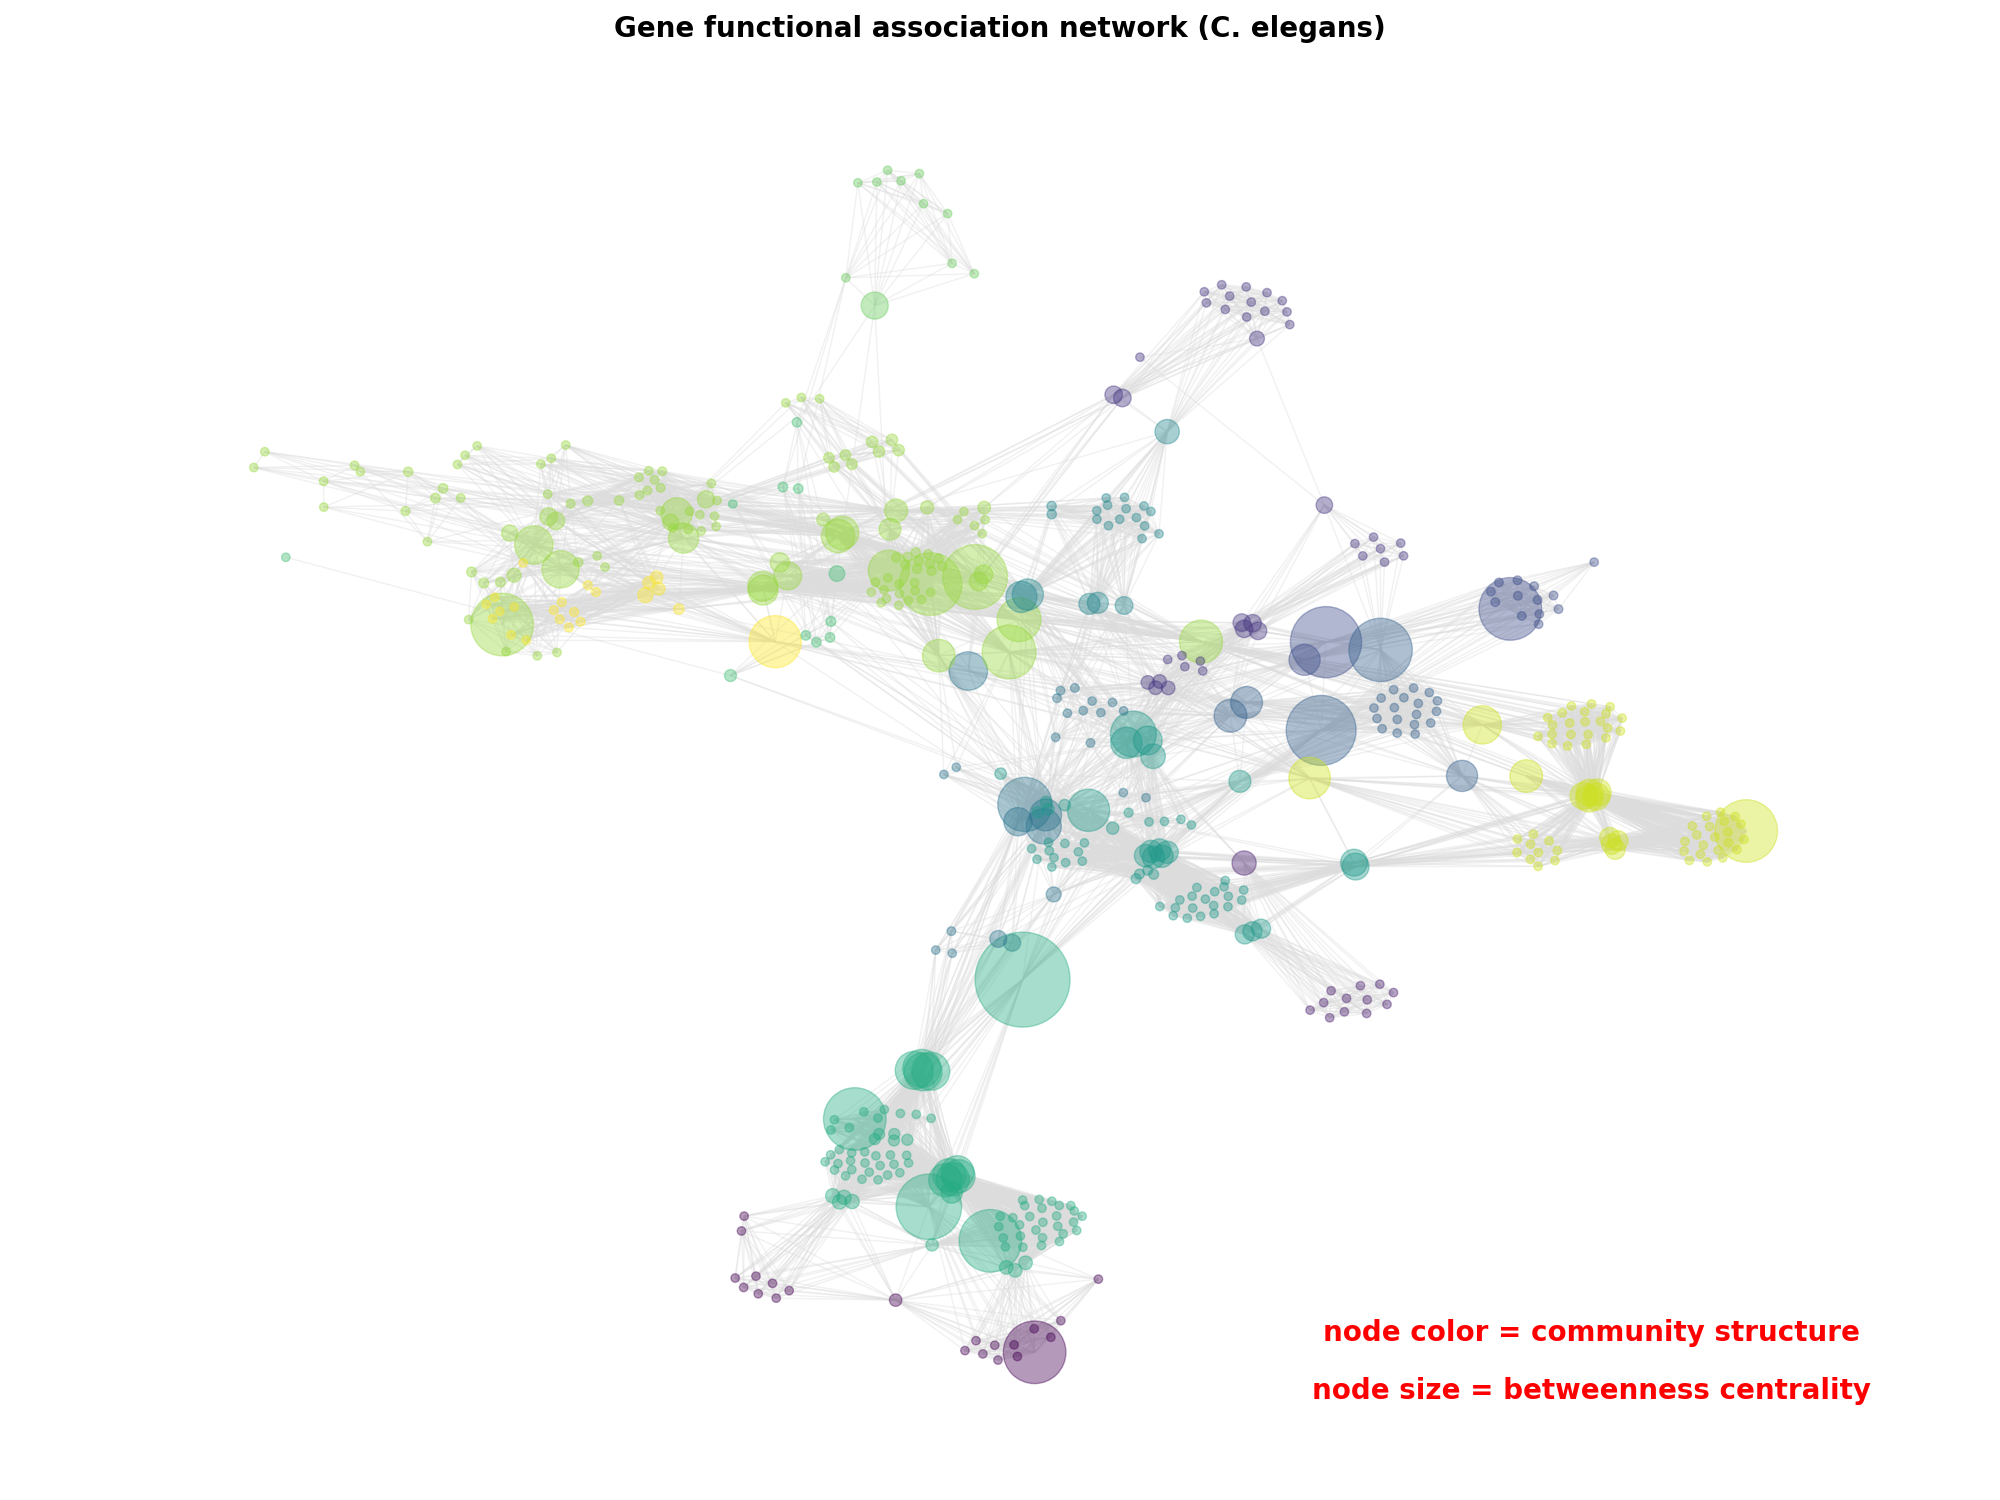
Below is an nice picture from networkX demonstrating betweeness centrality. This is just one of a few statistics that will be calculated and used in future work.
Notebook Contents:
# dbnomics cannot get metadata in python, so this countries list is from an R script :(
# countries=pd.read_csv(r'countries.csv')
# for econ in countries['REF_AREA']:
# data = fetch_series(
# provider_code='IMF',
# dataset_code='DOT',
# max_nb_series=1000000,
# dimensions={
# "FREQ":["M"],
# "REF_AREA":[f"{econ}"],
# "INDICATOR":["TXG_FOB_USD"]}
# )
# data.to_csv(f'data\{econ}.csv')
# path = r'data'
# directory = os.fsencode(path)
# dfList = []
# for file in os.listdir(directory):
# filename = os.fsdecode(file)
# if filename.endswith(".csv"):
# dfList.append(pd.read_csv(os.path.join(path, filename)))
# else:
# continue
# data = pd.concat(dfList)
# data.to_csv(os.path.join('DOTS.csv'))
data = pd.read_csv('DOTS.csv').drop(['Unnamed: 0', 'Unnamed: 0.1'], axis=1)
data.head()
@frequency | provider_code | dataset_code | dataset_name | series_code | series_name | original_period | period | original_value | value | FREQ | REF_AREA | INDICATOR | COUNTERPART_AREA | Frequency | Reference Area | Indicator | Counterpart Reference Area | |
---|---|---|---|---|---|---|---|---|---|---|---|---|---|---|---|---|---|---|
0 | monthly | IMF | DOT | Direction of Trade Statistics (DOTS) | M.1C_080.TXG_FOB_USD.1C_080 | Monthly – Export earnings: fuel – Goods, Value... | 1960-01 | 1960-01-01 | 4.95 | 4.95 | M | 1C_080 | TXG_FOB_USD | 1C_080 | Monthly | Export earnings: fuel | Goods, Value of Exports, Free on board (FOB), ... | Export earnings: fuel |
1 | monthly | IMF | DOT | Direction of Trade Statistics (DOTS) | M.1C_080.TXG_FOB_USD.1C_080 | Monthly – Export earnings: fuel – Goods, Value... | 1960-02 | 1960-02-01 | 8.45 | 8.45 | M | 1C_080 | TXG_FOB_USD | 1C_080 | Monthly | Export earnings: fuel | Goods, Value of Exports, Free on board (FOB), ... | Export earnings: fuel |
2 | monthly | IMF | DOT | Direction of Trade Statistics (DOTS) | M.1C_080.TXG_FOB_USD.1C_080 | Monthly – Export earnings: fuel – Goods, Value... | 1960-03 | 1960-03-01 | 6.00 | 6.00 | M | 1C_080 | TXG_FOB_USD | 1C_080 | Monthly | Export earnings: fuel | Goods, Value of Exports, Free on board (FOB), ... | Export earnings: fuel |
3 | monthly | IMF | DOT | Direction of Trade Statistics (DOTS) | M.1C_080.TXG_FOB_USD.1C_080 | Monthly – Export earnings: fuel – Goods, Value... | 1960-04 | 1960-04-01 | 7.10 | 7.10 | M | 1C_080 | TXG_FOB_USD | 1C_080 | Monthly | Export earnings: fuel | Goods, Value of Exports, Free on board (FOB), ... | Export earnings: fuel |
4 | monthly | IMF | DOT | Direction of Trade Statistics (DOTS) | M.1C_080.TXG_FOB_USD.1C_080 | Monthly – Export earnings: fuel – Goods, Value... | 1960-05 | 1960-05-01 | 9.70 | 9.70 | M | 1C_080 | TXG_FOB_USD | 1C_080 | Monthly | Export earnings: fuel | Goods, Value of Exports, Free on board (FOB), ... | Export earnings: fuel |
keepCols=['series_code', 'period', 'value', 'REF_AREA', 'INDICATOR', 'COUNTERPART_AREA', 'Reference Area', 'Counterpart Reference Area']
cleanData = data[keepCols]
cleanData.rename(columns={'Counterpart Reference Area':'CounterpartReferenceArea',
'Reference Area':'ReferenceArea'}, inplace=True)
# drop groups
# clean nan filled economies
wideData = (cleanData
.pivot_table(
index=['period', 'CounterpartReferenceArea'],
columns='ReferenceArea',
values='value'))
wideData.head()
ReferenceArea | Afghanistan | Africa | Albania | Algeria | American Samoa | Angola | Anguilla | Antigua and Barbuda | Argentina | Armenia | ... | Sri Lanka | Sub-Saharan Africa | Sudan | Sweden | Switzerland | United Arab Emirates | United Kingdom | Western Hemisphere | Yemen Arab Rep. | Yemen, P.D. Rep. | |
---|---|---|---|---|---|---|---|---|---|---|---|---|---|---|---|---|---|---|---|---|---|---|
period | CounterpartReferenceArea | |||||||||||||||||||||
1960-01-01 | Advanced Economies (IMF) | NaN | 185.10 | NaN | NaN | NaN | 8.25 | NaN | NaN | 58.90 | NaN | ... | 22.15 | 169.85 | 5.55 | 172.4 | 103.2 | NaN | 541.0 | 336.70 | NaN | NaN |
Afghanistan | NaN | NaN | NaN | NaN | NaN | NaN | NaN | NaN | NaN | NaN | ... | NaN | NaN | NaN | NaN | 0.1 | NaN | 0.2 | NaN | NaN | NaN | |
Africa | NaN | 9.95 | NaN | NaN | NaN | 0.45 | NaN | NaN | 0.35 | NaN | ... | 1.60 | 9.05 | 0.20 | 8.9 | 4.1 | NaN | 100.9 | 3.25 | NaN | NaN | |
Africa not allocated | NaN | NaN | NaN | NaN | NaN | NaN | NaN | NaN | NaN | NaN | ... | NaN | NaN | NaN | 0.2 | 0.2 | NaN | 0.1 | 0.20 | NaN | NaN | |
Albania | NaN | NaN | NaN | NaN | NaN | NaN | NaN | NaN | NaN | NaN | ... | NaN | NaN | NaN | NaN | NaN | NaN | NaN | NaN | NaN | NaN |
5 rows × 186 columns
# remove groups
# decided to keep 'Special Categories and Economic Zones' - these are treated like seperate economies so shouldn't create double counting
removeList = [
'Export earnings: fuel',
'Export earnings: nonfuel',
'Middle East, North Africa, Afghanistan, and Pakistan',
'Emerging and Developing Europe',
'Western Hemisphere',
'Western Hemisphere not allocated',
'EU (Member States and Institutions of the European Union) changing composition',
'Euro Area (Member States and Institutions of the Euro Area) changing composition',
'Europe',
'Europe not allocated',
'Africa',
'Africa not allocated',
'Sub-Saharan Africa',
'Middle East',
'Middle East and Central Asia not specified',
'Other Countries n.i.e. (IMF)',
'Advanced Economies (IMF)',
'Emerging and Developing Countries',
'Developing Asia (IMF)',
'Middle East and Central Asia',
'Belgo-Luxembourg Economic Union',
'Community of Independent States (CIS)',
'Asia not allocated',
'Former U.S.S.R.',
'All Countries, excluding the IO']
dataLong = (wideData
.melt(ignore_index=False)
.query('CounterpartReferenceArea not in @removeList')
.query('ReferenceArea not in @removeList')
)
print("Lost: ", np.round((wideData.melt().shape[0] - dataLong.shape[0]) / wideData.melt().shape[0], 2) * 100, "% rows due to dropping groups")
wideData2 = dataLong.pivot_table(index=['period', 'CounterpartReferenceArea'],
columns='ReferenceArea',
values='value')
dataLong.reset_index(inplace=True)
dataLong.rename(columns={'value':'weight'}, inplace=True)
Lost: 17.0 % rows due to dropping groups
colna = wideData2.isna().sum()
colna = colna / wideData2.shape[0]
colna.nlargest(20)
ReferenceArea Yemen Arab Rep. 0.980017 Kiribati 0.978837 Yemen, P.D. Rep. 0.977686 Micronesia, Federated States of 0.972135 Palau 0.968415 Marshall islands 0.952022 Curacao 0.951971 Montserrat 0.950386 Falkland Islands (Malvinas) 0.945566 Aruba 0.942041 Lesotho 0.938285 Bhutan 0.936331 Nauru 0.935144 Anguilla 0.933204 Comoros 0.931257 Guam 0.931206 Guinea-Bissau 0.924700 Montenegro 0.924273 Cabo Verde 0.921146 Maldives 0.916847 dtype: float64
colna.nsmallest(20)
ReferenceArea United Kingdom 0.076060 France 0.104866 Netherlands 0.107131 Japan 0.113985 Italy 0.123655 Germany 0.133925 Denmark 0.140707 Switzerland 0.193266 Sweden 0.215312 Spain 0.226436 India 0.241244 Hong Kong, China 0.246513 Canada 0.248967 Austria 0.273452 Brazil 0.305500 Norway 0.310089 Finland 0.312991 Ireland 0.327741 Australia 0.334718 Korea, Republic of 0.349961 dtype: float64
# this chunck calculates the network statistics
from networkx.algorithms.approximation.connectivity import node_connectivity
from networkx.algorithms.bridges import has_bridges
from networkx.algorithms.link_analysis.pagerank_alg import pagerank, pagerank_numpy
from networkx.algorithms.approximation.connectivity import node_connectivity
from networkx.algorithms.bridges import has_bridges
# https://stackoverflow.com/questions/20625582/how-to-deal-with-settingwithcopywarning-in-pandas
pd.options.mode.chained_assignment = None
dates = dataLong['period'].unique()
stats=[]
for date in dates:
tempData=dataLong.query('period == @date')
tempData.dropna(axis=0, inplace=True)
G = nx.from_pandas_edgelist(df = tempData,
source = "ReferenceArea",
target = "CounterpartReferenceArea",
edge_attr = "weight",
create_using = nx.DiGraph())
tempdf = pd.DataFrame( dict(
# key data
# typf of graph
#graphType = G.
PERIOD = date,
# --------------------------------MICRO
## ---- Centrality
# returns a dict of node's degree
DEGREE = dict(G.degree),
IN_DEGREE = dict(G.in_degree),
OUT_DEGREE = dict(G.out_degree),
# fraction of nodes a node is connected to
DEGREE_CENTRALITY = nx.degree_centrality(G),
IN_DEGREE_CENTRALITY = nx.in_degree_centrality(G),
OUT_DEGREE_CENTRALITY = nx.out_degree_centrality(G),
AVG_NEIGHBOR_DEGREE = nx.average_neighbor_degree(G),
# centrality based on importance of edges
PAGERANK = pagerank(G, weight = 'weight'),
PAGERANK_NUMPY = pagerank_numpy(G, weight = 'weight'),
# centrality based on neighbors
#EIGENVECTOR_CENTRAL = nx.eigenvector_centrality_numpy(G),
# generalization of eigen centrality
KATZ = nx.katz_centrality_numpy(G),
CLOSENESS_CENTRALITY = nx.closeness_centrality(G),
BETWEENNESS_CENTRALITY = nx.betweenness_centrality(G),
## ---- Paths
## ---- Clustering
# node clustering scores
CLUSTCOEF = nx.clustering(G),
#-----------------------------------MACRO
## --- Size
NUM_NODES = G.number_of_nodes(),
NUM_EDGES = G.number_of_edges(),
TOTAL_NET_VALUE = tempData['weight'].sum(),
## ----- Connectivity
CONNECTIVITY = node_connectivity(G),
# edge whose removal causes the number of connected components of the graph to increase
HAS_BRIDGE = has_bridges(nx.Graph(G)),
## ---- Clustering
# ego net clusterting score
# graph clustering score
AVERAGECLUSTCOEF = nx.average_clustering(G),
TRIANGLES = nx.triangles(nx.Graph(G)),
))
stats.append(tempdf)
statDF = pd.concat(stats)
statDF.reset_index(inplace=True)
statDF['PERIOD'] = pd.to_datetime(statDF['PERIOD'])
statDF.to_csv('DOTSnetStats.csv')
# yes these charts are not super informative but look cool and let's us see the data composition effects
import matplotlib.dates as mdates
statDF['PERIOD'] = pd.to_datetime(statDF['PERIOD'])
statsList = [
'DEGREE',
'DEGREE_CENTRALITY',
'AVG_NEIGHBOR_DEGREE',
'BETWEENNESS_CENTRALITY',
'CLOSENESS_CENTRALITY',
'CLUSTCOEF',
'NUM_EDGES',
'NUM_NODES',
'AVERAGECLUSTCOEF',
'TRIANGLES',
'PAGERANK']
for stat in statsList:
temp = statDF.pivot_table(index='PERIOD', columns='index', values=stat)
plt.figure()
for col in temp.columns:
plt.plot(temp.index, temp[[col]])
# https://stackoverflow.com/a/49573439/11706269
ax=plt.gca()
ax.xaxis.set_major_locator(mdates.YearLocator(10))
ax.xaxis.set_major_formatter(mdates.DateFormatter('%Y'))
ax.set_title(stat)
pagerank plot china in yellow catching up to the US in blue ~1980 large increase in nodes and edges, affects the avg cluster coef, triangles
below are some invididual charts I thought were worth pointing out when playing around with the data
temp = statDF.pivot_table(index='PERIOD', columns='index', values='NUM_EDGES')
temp = temp.query('PERIOD > "2013-01-01"')
plt.figure()
for col in temp.columns:
plt.plot(temp.index, temp[[col]])
# https://stackoverflow.com/a/49573439/11706269
ax=plt.gca()
ax.xaxis.set_major_locator(mdates.YearLocator(1))
ax.xaxis.set_major_formatter(mdates.DateFormatter('%Y'))
ax.set_title('Recent Total Number of Edges in Global Trade Network')
Text(0.5, 1.0, 'Recent Total Number of Edges in Global Trade Network')
temp = statDF.pivot_table(index='PERIOD', columns='index', values='TOTAL_NET_VALUE')
plt.figure()
for col in temp.columns:
plt.plot(temp.index, temp[[col]])
# https://stackoverflow.com/a/49573439/11706269
ax=plt.gca()
ax.xaxis.set_major_locator(mdates.YearLocator(10))
ax.xaxis.set_major_formatter(mdates.DateFormatter('%Y'))
ax.set_title('Total Value of Global Trade Network')
Text(0.5, 1.0, 'Total Value of Global Trade Network')
temp = statDF.pivot_table(index='PERIOD', columns='index', values='AVERAGECLUSTCOEF')
temp = temp.query('PERIOD > "2015-01-01"')
plt.figure()
for col in temp.columns:
plt.plot(temp.index, temp[[col]])
# https://stackoverflow.com/a/49573439/11706269
ax=plt.gca()
ax.xaxis.set_major_locator(mdates.YearLocator(1))
ax.xaxis.set_major_formatter(mdates.DateFormatter('%Y'))
ax.set_title('Average Clustering Coefficient')
Text(0.5, 1.0, 'Average Clustering Coefficient')
temp = statDF.pivot_table(index='PERIOD', columns='index', values='PAGERANK')
temp = temp.query('PERIOD > "2005-01-01"')
plt.figure()
for col in temp.columns:
plt.plot(temp.index, temp[[col]])
# https://stackoverflow.com/a/49573439/11706269
ax=plt.gca()
ax.xaxis.set_major_locator(mdates.YearLocator(1))
ax.xaxis.set_major_formatter(mdates.DateFormatter('%Y'))
ax.set_title('Page Rank Scores')
Text(0.5, 1.0, 'Page Rank Scores')
def lineChart(indicator:str, period:str, econ:str, title:str):
temp = statDF.pivot_table(index='PERIOD', columns='index', values=indicator)
temp = temp.query('PERIOD > @period')
temp=temp[[econ]]
plt.figure()
for col in temp.columns:
plt.plot(temp.index, temp[[col]])
# https://stackoverflow.com/a/49573439/11706269
ax=plt.gca()
ax.xaxis.set_major_locator(mdates.YearLocator(5))
ax.xaxis.set_major_formatter(mdates.DateFormatter('%Y'))
ax.set_ylim(ymin=0)
ax.set_title(title)
return(ax)
lineChart('PAGERANK', '1960-01-01','China', 'China Increase in PageRank')
<AxesSubplot:title={'center':'China Increase in PageRank'}>
lineChart('PAGERANK', '1981-01-01','Italy', 'Seasonality in Italys PageRank Score?')
<AxesSubplot:title={'center':'Seasonality in Italys PageRank Score?'}>
lineChart('PAGERANK', '1960-01-01','India', 'India Increase in PageRank')
<AxesSubplot:title={'center':'India Increase in PageRank'}>
lineChart('PAGERANK', '1990-01-01','Macao', 'Episodes of Increased Vol in Macaos PageRank Score')
<AxesSubplot:title={'center':'Episodes of Increased Vol in Macaos PageRank Score'}>
lineChart('PAGERANK', '2005-01-01','Moldova, Republic of', 'Moldovas PageRank Spike')
<AxesSubplot:title={'center':'Moldovas PageRank Spike'}>
lineChart('PAGERANK', '2005-01-01','Montserrat', 'Montserrat PageRank Spike')
<AxesSubplot:title={'center':'Montserrat PageRank Spike'}>
lineChart('PAGERANK', '1990-01-01','Namibia', 'Namibia PageRank Episode')
<AxesSubplot:title={'center':'Namibia PageRank Episode'}>
lineChart('PAGERANK', '2008-01-01','Paraguay', 'Paraguay PageRank Spike')
<AxesSubplot:title={'center':'Paraguay PageRank Spike'}>
lineChart('PAGERANK', '1995-01-01','Poland', 'Poland Increase in PageRank')
<AxesSubplot:title={'center':'Poland Increase in PageRank'}>
lineChart('PAGERANK', '1995-01-01','Switzerland', 'Seasonality in Switzerland PageRank?')
<AxesSubplot:title={'center':'Seasonality in Switzerland PageRank?'}>
lineChart('PAGERANK', '1995-01-01','Thailand', 'Thailand Increase in PageRank')
<AxesSubplot:title={'center':'Thailand Increase in PageRank'}>
lineChart('PAGERANK', '1970-01-01','United Arab Emirates', 'UAE Increase in PageRank')
<AxesSubplot:title={'center':'UAE Increase in PageRank'}>
lineChart('PAGERANK', '1982-01-01','United Kingdom', 'UK Decrease in PageRank')
<AxesSubplot:title={'center':'UK Decrease in PageRank'}>
lineChart('PAGERANK', '1982-01-01','Viet Nam', 'Viet Nam Increase in PageRank')
<AxesSubplot:title={'center':'Viet Nam Increase in PageRank'}>